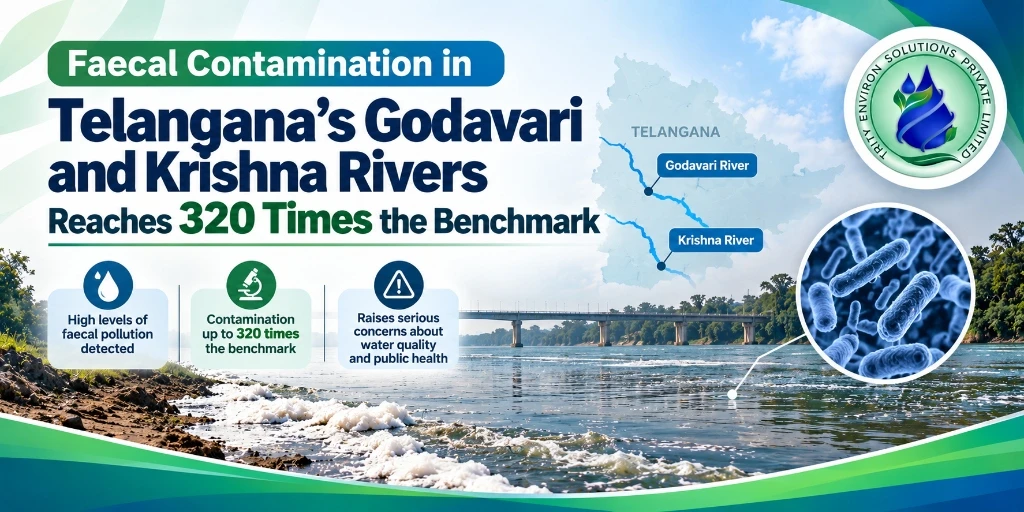
Faecal contamination in stretches of the Godavari and Krishna rivers in Telangana has risen sharply, according to Central Water Commission (CWC) monitoring data reported on October 26. At three locations, faecal coliform reached 160,000 MPN per 100 ml, which the report describes as 320 times the reference benchmark.
The figures are for August. They point to a sewage problem that reaches well beyond Hyderabad.
What the CWC Data Shows
Faecal coliform is a bacterial indicator of contamination from human or animal waste. MPN stands for most probable number, the unit used to count it.
The highest readings
- 160,000 MPN per 100 ml: the Krishna at Suryapet, and the Godavari at Mulugu and Nizamabad. The report calls this 320 times the benchmark
- 92,000 MPN per 100 ml: Bhadrachalam and Mancherial, or 184 times the benchmark
- About 9,200 MPN per 100 ml in June: nearly 20 times the benchmark
- Rise from June to August: more than 1,600%
Other monitoring points in Mulugu and Bhadradri Kothagudem, and the Musi river at Valigonda, also exceed benchmarks.
Checking the arithmetic
The ratios imply a reference benchmark of 500 MPN per 100 ml. That matches the figures: 160,000 divided by 500 is 320, and 92,000 divided by 500 is 184. The rise from 9,200 to 160,000 is about 1,639%, which fits "more than 1,600%". These calculations are ours, based on the published numbers.
The Musi at Valigonda
The Musi shows pollution of a different kind in the data.
- Dissolved oxygen: 1.28 mg/L, against a reference of at least 5 mg/L
- Biochemical oxygen demand (BOD): 10.94 mg/L, against a limit of 3 mg/L
Low oxygen and high BOD together point to heavy organic load. Fish and other aquatic life need oxygen, and when it falls this far the river struggles to sustain them.
How to Read These Numbers
An MPN figure is a statistical estimate of bacteria in a 100 ml sample. It is not a precise count, and a single reading can swing widely. What matters is the order of magnitude and the pattern across sites.
What the pattern shows
- The highest readings are on two different rivers, the Krishna at Suryapet and the Godavari at Mulugu and Nizamabad. This is not a one-river problem
- Several points exceed the benchmark, so the issue is spread across the state's river network
- The jump from June to August is large enough that it is unlikely to be explained by sampling variation alone
What the data leaves open
- Whether the readings were taken at the same time of day and in similar flow conditions
- Whether the contamination is from point sources, such as drain outfalls, or from diffuse runoff
- How far downstream the effect travels before the river recovers
Who Is Most Exposed
- People in villages and towns that draw untreated river water for household use
- Communities that bathe, wash clothes and collect water at the river
- Towns whose water treatment plants have to cope with higher bacterial loads in the monsoon
The report does not say how many people use these stretches, so no exposure figure is given here.
What Is Behind the Contamination
The report cites several contributors.
- Untreated or poorly treated sewage
- Leaking sewer lines
- Septic tanks
- Drains and runoff
A 2024 study by NIT Warangal, commissioned by the Union Ministry of Jal Shakti, assessed the Krishna basin. It also flags pharmaceutical and chemical industrial pollution in the Telangana stretch of the Krishna.
The report does not say how much each source contributes, and it does not show whether the August levels persisted after the monsoon. So the causes are listed, not ranked.
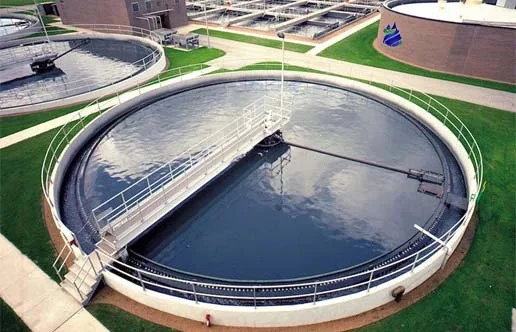
The Sewage Treatment Gap in Greater Hyderabad
The report gives two numbers for the city.
- 42 sewage treatment plants (STPs) are operating, with 36 more in the pipeline
- Only about 600 high-rise buildings and gated communities are reported to have functional sewage-treatment facilities
This is not a measure of how much sewage Hyderabad produces or treats, because the report gives no volumes. What it does show is that decentralised treatment, at the level of buildings and communities, is thin.
Why August Readings Can Spike
This is general background and not a finding from the report.
Monsoon flows can wash waste from streets, open drains and overflowing septic systems into rivers. Higher flow also dilutes pollutants, so readings depend on where sewage enters the river and how much rain falls. Bacterial counts can therefore swing widely between months, which is why a June-to-August comparison should be read alongside data from other months.
Why Faecal Coliform Matters for Public Health
Faecal indicator bacteria do not themselves tell us which pathogens are present. They show that waste has entered the water, which raises the risk of waterborne disease for people who drink, bathe in or use untreated river water.
- Towns downstream that draw raw water need effective treatment and disinfection
- Communities that use river water directly face the highest exposure
- Rivers used for religious bathing and recreation need regular monitoring
Why Rivers Need Regular Monitoring
A single CWC reading shows the state of the river at one place and time. A series of readings shows whether it is getting better or worse. The June-to-August jump is useful precisely because June provides a baseline.
Public reporting of monthly data, with the benchmark stated alongside, lets residents and local bodies see changes early rather than after a season of exposure.
What Would Bring the Numbers Down
Treat sewage at the source
- Build and connect STPs to the sewer network
- Fix leaking lines, which let sewage escape before it reaches a plant
- Require functional treatment in large apartment complexes and commercial buildings
Make plants perform
- Check outlet BOD, COD and faecal coliform regularly
- Keep disinfection working, since a plant can reduce BOD yet still discharge bacteria
- A structured operation and maintenance contract keeps plants meeting norms after commissioning
Treat on site where networks are thin
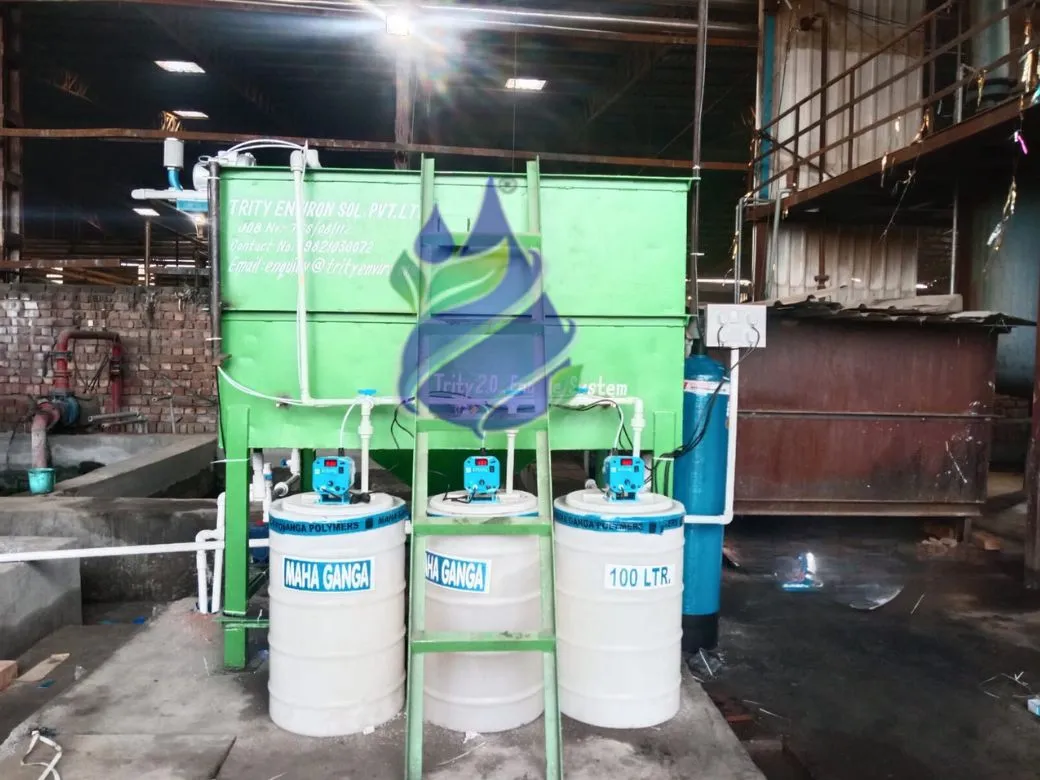
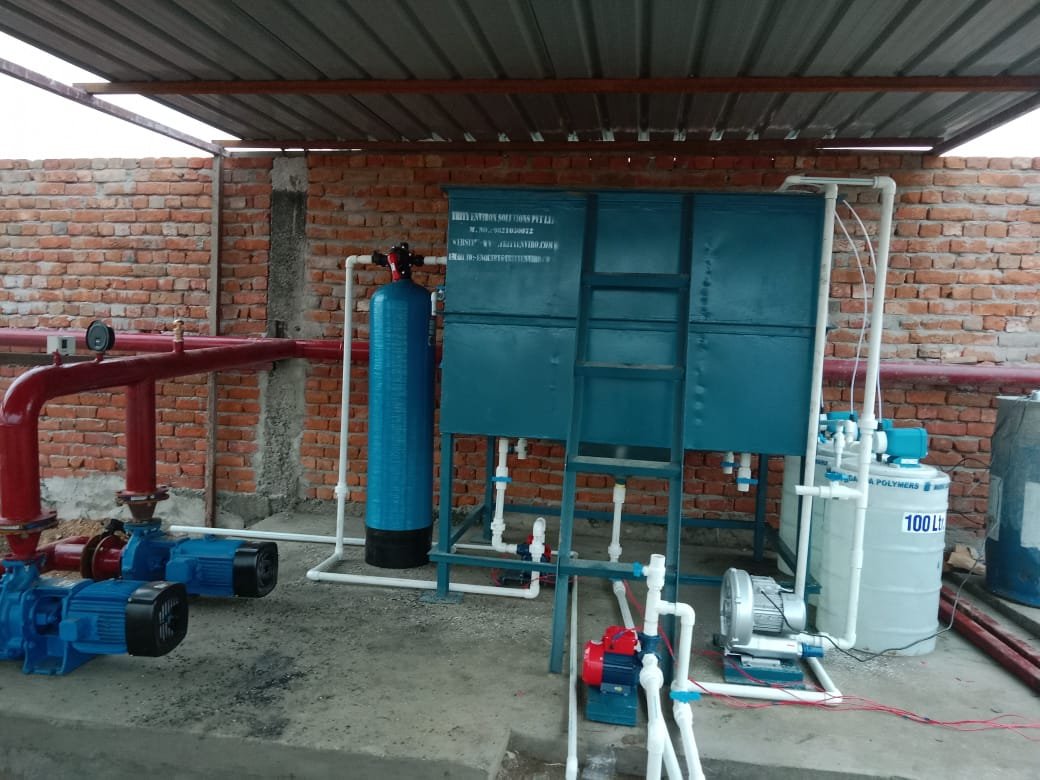
Large housing societies, campuses and hospitals can run their own sewage treatment plant. Treated water can be reused for flushing and gardening, cutting both pollution and freshwater demand.
Control industrial effluent
Industrial units in the Krishna stretch, including pharmaceutical and chemical units flagged in the NIT study, need compliant effluent treatment plant systems and regular monitoring.
What to Watch Next
- CWC data for September and October, to see whether August was a peak or a trend
- Any response from Telangana's pollution control board or the water authorities
- Progress on the 36 STPs in the pipeline for Greater Hyderabad
- Whether the Musi's dissolved oxygen and BOD improve