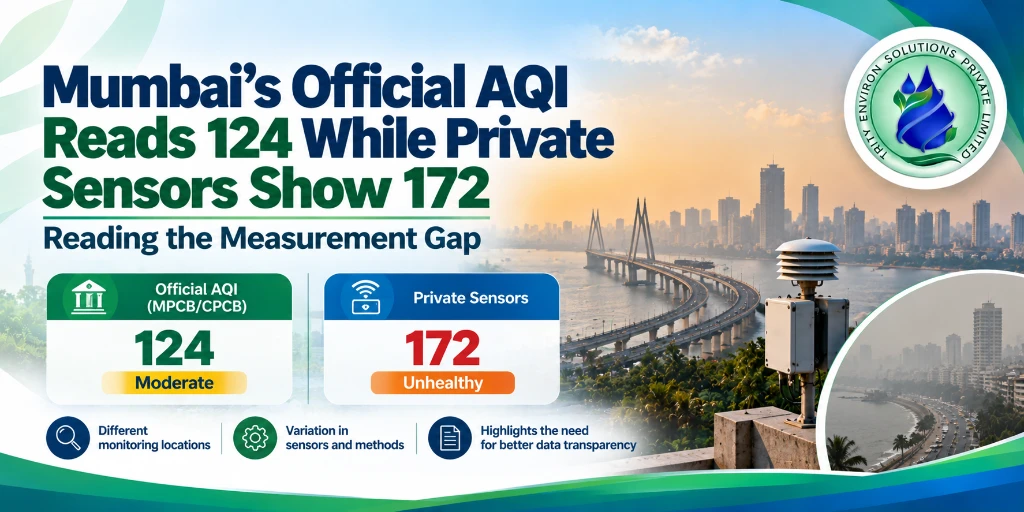
Mumbai's official monitoring network reported an average Air Quality Index (AQI) of 124 on October 26, in the "moderate" category. Private sensors using the US AQI scale showed an average of 172, fluctuating between 165 and 186 during the day.
The two numbers describe the same city on the same day, yet they point to different levels of risk. The gap raises a practical question for residents: which number should they trust, and what does each one actually measure?
The Two Sets of Numbers
Official network (India's AQI)
- Mumbai average: 124, "moderate"
- Most polluted: BKC at 169
- Andheri East: 162
- Mazgaon and Worli: 161 each
- Mankhurd: 151
- Colaba: 149
- Cleanest: Ghatkopar at 38 ("good"), Kandivli at 64 and Powai at 98
Private sensors (US AQI)
- Mumbai average: 172, ranging from 165 to 186
- Juhu JVPD Scheme: average 179
- Bandra Hill Road: average 177, range 169 to 198
- US Consulate at BKC: range 184 to 229
Neighbouring cities (official)
- Navi Mumbai: average 118, "moderate". Mahape was highest at 141, Nerul 139, Sanpada 104 and Taloja lowest at 102
- Thane: average 120, "moderate"
These figures are from a single analysis published on October 26. It names no officials or experts, and it does not say whether the authorities have responded.
Why the Numbers Differ
The analysis calls the gap a "measurement gap, not a definitive verdict" on either network. Several factors can explain it, though the report does not say which apply here.
Different scales
The official network uses India's National AQI, while the private sensors use the US AQI. The two scales use different breakpoints, so the same air can get different numbers and labels. A US AQI of 172 falls in the "unhealthy" band, while an Indian AQI of 124 is "moderate". They should not be compared directly.
Different locations and equipment
- Sensor placement matters. A sensor near a busy road will read higher than one in a park
- Instruments differ in type, calibration and sampling frequency
- Conversion methods from raw readings to an AQI figure can differ
Averages hide the spread
A citywide figure blends very different neighbourhoods. In the official data alone, Ghatkopar read 38 while BKC read 169, a spread of more than 130 points on the same day. Which number applies to you depends on where you live and work.
The analysis does not say whether private sensors were calibrated against official stations, so it cannot say which network is more accurate.
Comparing Apps and Websites Without Getting Misled
Residents often see several AQI numbers for the same place. These checks help.
- Look for the scale. If an app says "US AQI", its bands differ from India's. A reading of 172 on the US scale is "unhealthy", and the same air might be labelled "moderate" on India's scale
- Look for the source. A government station, a research-grade instrument and a low-cost sensor are different things. Low-cost sensors are useful for showing local differences but need calibration against reference instruments
- Look at the time. The private sensor figures here fluctuated by more than 20 points during the day, so a single snapshot can mislead
- Look at the place. The nearest sensor to your home matters more than the city average
None of this means private networks are wrong. It means each number answers a slightly different question.
The BKC Reading
BKC is the most polluted official station in this data at 169, and the US Consulate sensor there showed 184 to 229 on the US scale. Both networks therefore agree that BKC is among the worst locations, even though the numbers differ.
This matters because the Bandra Kurla Complex has heavy traffic and ongoing construction. The analysis does not attribute the readings to any cause, and neither does this article.
Mumbai Earlier This Month
A UNI India report on October 10 put Mumbai's AQI at 179, in the "poor" category, driven by hot and humid weather. The October 26 official average of 124 is lower, but the two figures come from different days and may use different station sets. They should not be read as a trend.
One Region, Three Reporting Systems
The analysis makes a wider point. Metropolitan Mumbai, Navi Mumbai and Thane are reported separately, though they work as one connected system. People commute daily across all three, and wind carries pollutants across their boundaries.
The official readings show moderate air in all three: 124, 118 and 120. A single regional view would make it easier to see patterns that the separate reports miss.
What Residents Can Do
These are general suggestions and not official advice.
- Check the AQI near where you live, not only the citywide average
- Note which scale a figure uses before comparing apps and websites
- Sensitive groups, including people with asthma or heart disease, can treat private readings in the 150s and above as a prompt to limit outdoor exertion
- Keep windows closed on days with strong traffic or dust, and use damp cleaning rather than dry sweeping
What Builders and Industry Can Do
Neighbourhood hotspots are where enforcement matters most.
- Construction sites should keep dust screens in place and damp surfaces
- Industrial units should keep stack emissions within consent limits. Calibrated SOx NOx gas analysers help operators see deviations as they happen
- Facilities should keep monitoring records ready, because public attention on readings is rising
Why This Debate Matters for Policy
Action thresholds depend on the numbers. Restrictions that apply above a certain AQI, such as those under Delhi's GRAP system, are triggered by the official figure. If official and private readings differ widely, the public may feel that action is late, or that warnings are overstated.
Clear communication helps in both cases. When authorities explain the scale and the stations behind a figure, residents can judge for themselves and are less likely to dismiss either number.
What Would Help
- Public information on how private and official networks compare when placed side by side
- More official stations in areas where private sensors report higher readings
- A published explanation of how readings are converted to AQI figures
- Regional reporting that covers Mumbai, Navi Mumbai and Thane together
What to Watch Next
- Whether the pollution control authorities respond to the private readings
- Whether the gap between networks persists in November, when winter conditions set in
- Whether BKC's readings stay at the top of the official list