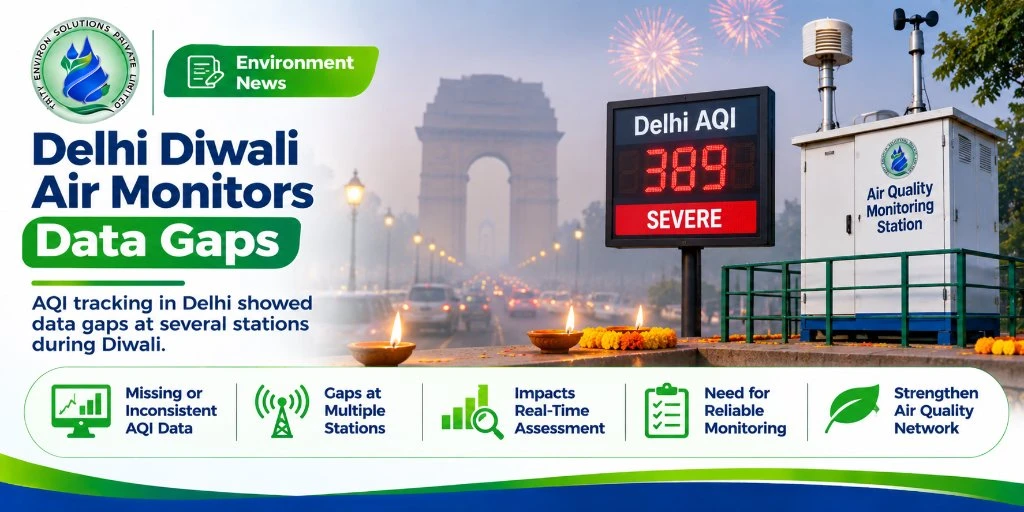
Delhi had its worst Diwali-night air in five years on Sunday, November 8. Reports now say that for much of that night, a large part of the city's air-monitoring network did not record complete data.
According to figures attributed to The Indian Express, 45 of 59 monitoring stations had missing hourly readings for at least one pollutant. Experts say the official peak is therefore likely understated.
What the Reports Say
The details below come from a Siasat Daily report of November 9, which attributes the station-level figures to The Indian Express. The Indian Express article itself was not accessible to us.
The scale of the gaps
- 45 of Delhi's 59 stations had at least one pollutant with missing hourly readings
- Only 14 stations reported complete data, according to analyst Manoj Kumar of the Centre for Research on Energy and Clean Air (CREA)
- Lodhi Road had 96 of 192 expected hourly readings missing across eight monitored parameters
- Other stations with large gaps: IIT Delhi (63), Burari Crossing (62), North Campus (55), Pusa (52) and CRRI Mathura Road (51)
The report labels two stations with the same code, so station-level mapping may be inconsistent in the source.
Gaps by pollutant
- Sulphur dioxide: 253 missing readings, the most of any single pollutant
- Ammonia: 221
- PM10: 116
- PM2.5: 55
PM10 gaps were concentrated at IIT Delhi, Burari Crossing, North Campus, Sonia Vihar and NSIT Dwarka. PM2.5 gaps were concentrated at DTU, Burari Crossing and NSIT Dwarka.
Why the Gaps Matter
The 1,000 µg/m3 ceiling
The report cites an instrument upper measurement limit of 1,000 micrograms per cubic metre. CREA's Manoj Kumar said missing readings coincided with concentrations near that limit.
His argument is simple. If a monitor goes blank because the air is too polluted for it to measure, then treating the gap as ordinary missing data pulls the average down. He suggested a more conservative approach, quoted in the report: flag such instances as potentially exceeding the instruments' range, and use 1,000 µg/m3 as a lower-bound estimate.
How far the official figure may be off
- The official citywide PM2.5 average peaked at 592 µg/m3 at 1 am, nearly ten times the 24-hour standard, per the report
- Sunil Dahiya of Envirocatalysts estimated that the true peak was near 800 µg/m3, based on stations that kept reporting
- Dahiya said many monitors went silent near 1,000 µg/m3 and several stayed offline for five hours or more
- At 8 am on Monday, PM2.5 was still close to 350 µg/m3, and the day's AQI was about 370
The 800 figure is an analyst's estimate and not an official reading.
Firecrackers and the 10 pm deadline
Sulphur dioxide nearly quadrupled, and most of the rise came after the Supreme Court's 10 pm firecracker deadline, according to the report. Dahiya said firecrackers drove most of the spike, and that Delhi was already breathing more than twice the safe limit before any cracker was burst.
Those are his assessments. A formal source apportionment for the night has not been published in the reports reviewed.
This Is Not the First Time
A ThePrint analysis published on November 8, 2025 looked at October 2025 data from 39 continuous monitoring stations and found a similar pattern.
- After midnight on October 21, 2025, 28 of 39 monitors went blank
- Aya Nagar's last reading was 892 µg/m3 and ITO's was 923 µg/m3 before it stopped at 2 am
- Chandni Chowk had 224 hours without PM2.5 data in the month
- Experts named sensor faults, transmission problems and sensors being overwhelmed as possible causes
- Delhi's environment minister at the time denied that data was missing and attributed any gap to a brief internet lapse or upload issue
- CPCB did not respond to the paper's requests for comment
The 2026 gaps therefore repeat a documented pattern. The reports reviewed do not say what caused this year's gaps, and no official explanation was reported.
What CPCB Has Said
The Siasat report does not carry any response from the Central Pollution Control Board (CPCB) to the missing data or the estimated peaks. It cites only CPCB's 592 µg/m3 average. If CPCB has announced a review of its monitoring system, we could not confirm it from the sources we reviewed.
Why Monitoring Gaps Change Policy
The Air Quality Index drives action. Stages of the Graded Response Action Plan (GRAP) depend on AQI levels and forecasts, so a reading that is too low can delay or weaken restrictions. The ThePrint analysis made the same point about hotspots where gaps were largest.
There is also a public-health angle. Residents checking an app on Diwali night saw numbers that may have been lower than what they were breathing.
How Continuous Monitors Reach Their Limits
This section is general background and not a finding about Delhi's stations.
- Every analyser has a measurement range. Readings above the top of the range can be capped, flagged as invalid or dropped
- Validation rules at the server end can reject values that look implausible, which can also remove genuine extreme readings
- Sampling lines, filters and sensors can clog or foul in very dense smoke
- Data can fail to transmit even when the instrument is working
Which of these applied on Diwali night is not stated in the reports.
What Better Practice Looks Like
These are general suggestions drawn from the experts' comments and standard monitoring practice, and are not official directions.
- Flag readings at or near the range ceiling as "over range" and not as missing
- Publish the number of valid hours behind every average
- Audit instruments that fail repeatedly under high load
- Use a mix of reference-grade and low-cost sensors to cross-check peaks
- Keep calibration and maintenance records open to the public
The same logic applies to stack monitoring
Industrial units face a similar problem on their own chimneys. Online stack monitors must stay in range, calibrated and transmitting, or the data cannot show compliance. Calibrated SOx NOx gas analysers and a routine operation and maintenance schedule are what keep such data usable. Delhi's recent figures on inactive industrial emission monitors point to the same gap.
What to Watch Next
- Whether CPCB or the Delhi Pollution Control Committee explains the gaps
- Whether peak values are revised or flagged as over-range
- Any audit of stations with repeated outages
- The CPCB and CAQM bulletins for the days after Diwali, when air quality stayed poor
Good air policy starts with good data. When the monitors fail at the worst moment, the record of that moment is the first casualty.