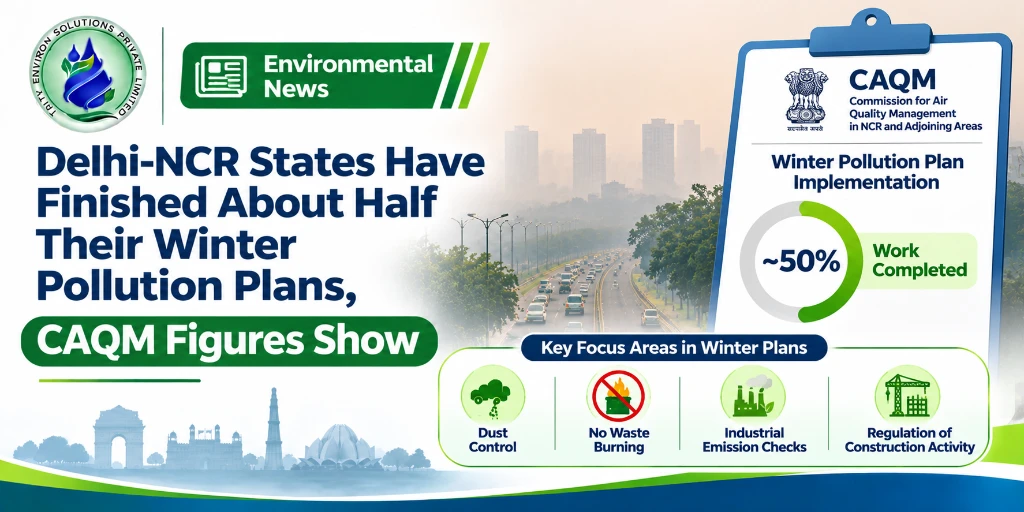
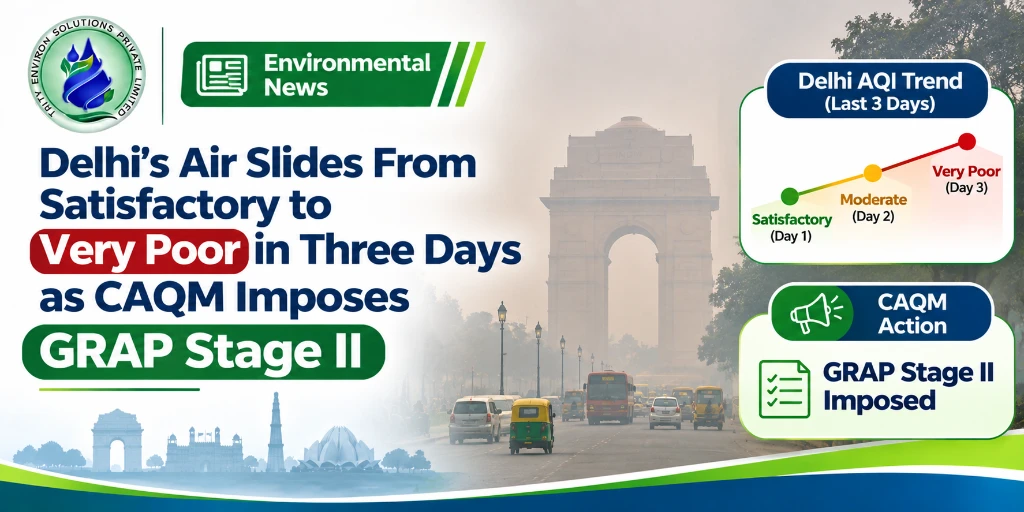
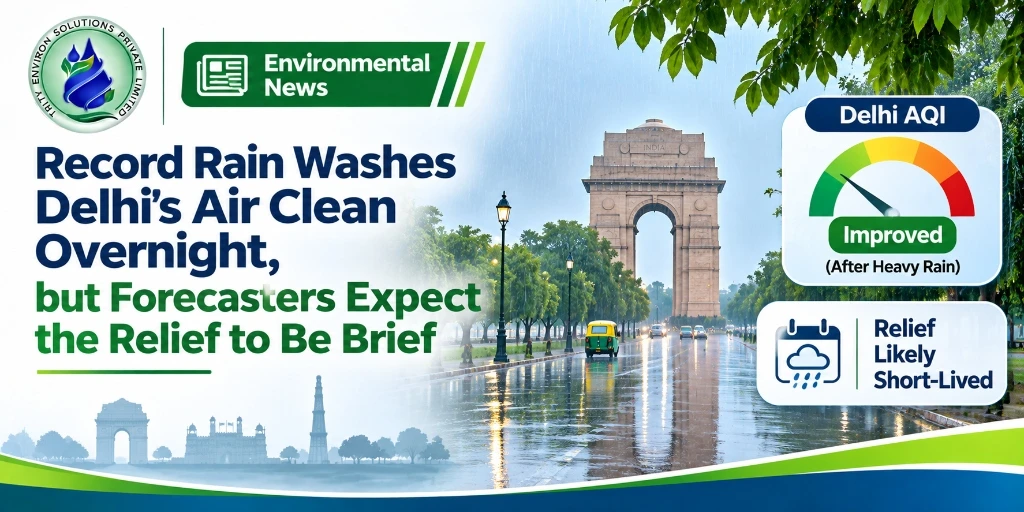
As Delhi's air turned "very poor" this week, new figures show how much of the region's anti-pollution work is still unfinished. Reports on October 29 said Delhi, Haryana, Rajasthan and Uttar Pradesh had completed roughly half of their promised measures. The Commission for Air Quality Management (CAQM) fact sheet reported on November 3 gives the detail.
The picture is mixed. Some items are largely done, while others, especially waste and dumpsite work, are far behind.
What the Reports Say
The headline finding
NewsBytes reported on October 29 that Delhi and nearby states had finished about one-half of their promised anti-pollution actions, with the page's description putting the range at 40 to 60%. It reported that Uttar Pradesh was leading and Rajasthan lagging, that large projects such as road upgrades were less than half done, and that in Delhi none of 70 new road-sweeping machines were operating yet.
That is a short summary of a longer Times of India report, which could not be accessed. The percentages and state ranking are therefore single-source.
The commission's own data
Outlook reported a CAQM fact sheet on November 3. The figures that follow come from that report.
Roads and Dust
- Road redevelopment: 2,700 of 5,480 km, about 49%
- Mechanical sweepers: 251 of 380 deployed, about 66%, a shortfall of 129
Road dust is a recurring target of GRAP restrictions, and both of these items affect it. The sweeper figure is for the region as reported, and the October 29 report on Delhi's own 70 machines relates to a different count.
Vehicles
PARIVARTAN scheme
The scheme, with a target date of July 2028, aims to replace older commercial vehicles. As of October 27, the fact sheet reports:
- Trucks: 2,935 of 28,929 registered trucks replaced, about 10%
- Buses: 613 of 10,434 registered buses replaced, about 6%
- Overall target: about 1.91 lakh trucks and 16,300 buses
Scrapping
A total of 1,44,567 vehicles were scrapped across the NCR in 2026. Uttar Pradesh accounted for 82,829 and Delhi for 58,369.
Industry
- Emission monitoring (OCEMS): 2,296 of 2,345 units connected to CPCB servers, about 98%
- Pollution control devices (APCDs): of 2,296 identified industries, 845 (about 37%) had submitted adequacy certificates, 409 had received exemptions and 1,042 (about 45%) still needed to install devices
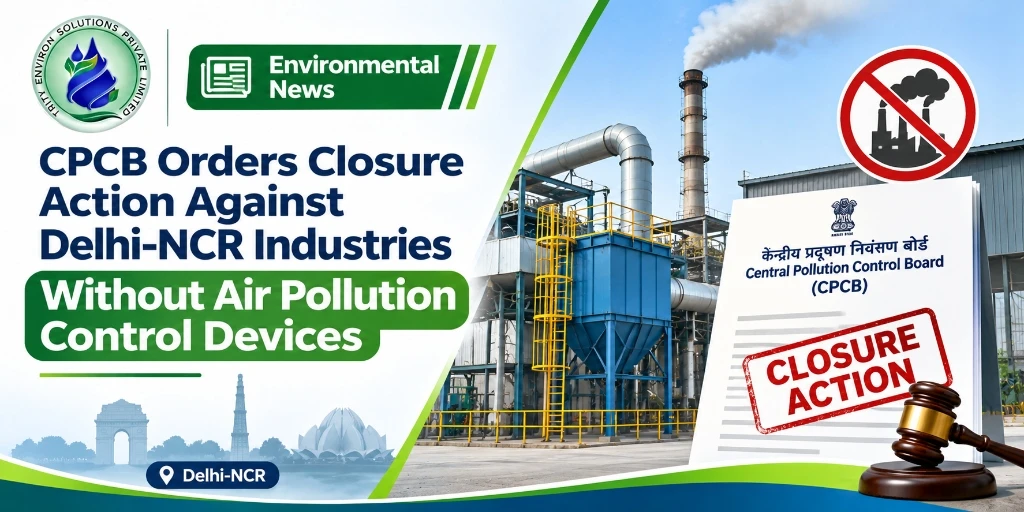
The industrial data matters because of the new Central Pollution Control Board direction of October 30, which orders closure show-cause notices for units with no APCD work orders or exemption certificates. The CPCB direction is covered in a separate article in this series. Readers can find CAQM's directions on its official website.
Waste
Municipal waste
- 11,786 of 18,533 tonnes per day processed, about 64%
- A gap of 6,747 tonnes per day
Legacy dumpsites
- Okhla: 17.73 of 26.38 lakh tonnes cleared, about 67%
- Bhalswa: 25.33 of 47.97 lakh tonnes cleared, about 53%
- Ghazipur: 13.63 of 44.61 lakh tonnes cleared, about 31%
Percentages here are the outlet's rounded figures. Our own division of the tonnes gives about 67%, 53% and 31%, which match.
Why waste belongs in an air-quality story
Open waste burning and landfill fires add to pollution, and unprocessed waste adds to the load on landfills. Delhi's dumpsites are also linked to leachate and groundwater concerns. Our reading of the Ghazipur case is covered in an earlier article on the National Green Tribunal's order about groundwater testing there.
Monitoring and Air Quality
- Monitoring stations: 116 of the 157 required, about 74%, are operational
- Delhi air quality to November 2: 220 good-air days against 200 in 2025, and 86 bad-air days against 106
The air-quality days are the commission's figures as reported. They show a better season so far than last year, even though the first week of November has been poor.
Stubble Burning
- Punjab: 1,514 farm fires from September 15 to November 1, down from 2,084 (a 38% fall)
- Haryana: 42 fires, down from 118 (64%)
- Burnt area to October 28: Punjab 7.92% of rice-growing area (14.6% in 2025) and Haryana 6.99% (16.8%)
- Straw used outside farms: doubled since 2023, reaching 7.89 million tonnes in Punjab and 2.71 million tonnes in Haryana
Other Measures
- Construction restrictions across the NCR from November 5 to 20
- Offices in six districts directed to allow up to 50% physical attendance
- A revised GRAP, adopted on September 29, 2026, that acts on air quality forecasts rather than waiting for AQI thresholds
Reading the Numbers Fairly
Where progress is clear
- Industrial monitoring is nearly complete
- Farm fires are down sharply on last year
- Vehicle scrapping is under way at scale
Where the gaps are
- Ghazipur is less than one-third cleared
- Fewer than half of the planned road redevelopments are done
- Only about 6 to 10% of the older buses and trucks have been replaced
- Over 1,000 industrial units have no APCD installed
What the numbers cannot tell us
The reports do not show how much each measure changes AQI, or which items are late against their own schedules. A percentage complete is not the same as being behind. Some projects have deadlines well into 2027 and 2028.
What Local Bodies and Industry Can Do
These are general suggestions and not directions from the commission.
- Local bodies: publish dumpsite and sweeping data monthly so residents can see progress
- Industry: if you are among the units without APCDs, act before notices arrive, and keep monitoring data ready. Our SOx NOx gas analyser page covers stack monitoring equipment
- Builders: follow dust rules for sites during the November 5 to 20 restrictions
- Wastewater-generating units: keep your effluent treatment plant running within norms, since inspectors often check air and water together
How to Read a Fact Sheet Like This
A progress table is a snapshot, and three cautions apply.
- Different baselines: each line uses its own target and date, so 49% of roads and 31% of a dumpsite are not directly comparable
- Inputs versus outcomes: sweepers deployed or tonnes processed measure effort, not air quality
- Reporting source: the figures are the commission's own, as carried by Outlook, and have not been audited by an independent body in the reports reviewed
Questions worth asking
- Which of these items have a deadline before the end of this winter?
- Who is responsible for each gap, the state, the municipal body or an agency?
- Will the commission publish updated percentages at regular intervals?
What to Watch Next
- CAQM's dashboard for tracking action plans, which Union Environment Minister Bhupender Yadav said has been set up, according to ANI
- Whether Delhi's road sweepers are operating at the planned scale
- Further data on dumpsite clearance at Ghazipur and Bhalswa
- Whether Rajasthan closes the gap with Uttar Pradesh
Half-finished plans do not clean the air by themselves. The fact sheet shows where the work still has to be done.