Why getting this calculation right matters more than it seems
Two mistakes show up repeatedly in STP capacity planning, and both are expensive. Undersizing a plant against actual or future occupancy leads to a system that cannot hold discharge norms once real usage kicks in, which means compliance notices, retrofits, and disrupted operations within a year or two of commissioning. Oversizing wastes capital on tankage, equipment, and civil work that will sit underutilized for years, sometimes for the entire life of the project if occupancy projections were never realistic to begin with. Our earlier explainer on KLD and MLD covers what these units mean and the basic calculation logic. This guide goes further, walking through the actual CPHEEO-based formulas, peak factor application, and worked examples across the project types that most commonly need this calculation done correctly: residential societies, hotels, hospitals, and industrial units.
The core formula and where the numbers come from
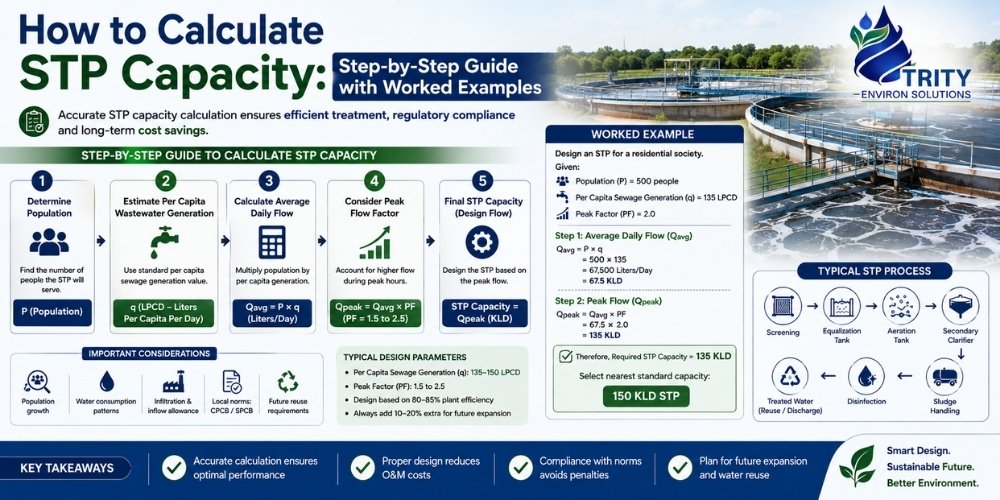
STP capacity calculation starts with a single foundational formula: population or occupancy multiplied by per-capita water consumption, adjusted for the fraction that returns as wastewater. The Central Public Health and Environmental Engineering Organisation, commonly referred to as CPHEEO, publishes standard per-capita water consumption norms used across India for exactly this kind of planning, and these norms vary by project type and, in some cases, by city classification.
CPHEEO's commonly used benchmarks include 135 litres per capita per day (LPCD) for urban residential areas with full plumbing, though this figure is sometimes adjusted downward for smaller towns or upward for premium developments with amenities like swimming pools and larger common areas. Not all of the water supplied returns as wastewater, since some is lost to evaporation, irrigation, or other non-recoverable uses, so a standard assumption of 80 percent return flow is commonly applied when converting water consumption figures into expected sewage generation. This return-flow assumption matters because using 100 percent of water supply as your wastewater figure will consistently oversize the plant.
Step-by-step calculation process
Step one is establishing population equivalent, or PE, which is the actual number of people the plant needs to serve. For residential projects, this is calculated as the number of dwelling units multiplied by expected occupancy per unit, commonly assumed at 4 to 5 persons per flat depending on unit size and local norms, though this should ideally be checked against RERA-approved occupancy figures rather than assumed uniformly across a project.
Step two applies the relevant per-capita water consumption norm to convert population equivalent into a daily water demand figure. This is where project type matters significantly, since a hospital, hotel, or industrial facility has a completely different per-capita or per-unit consumption pattern than a residential society, and using a residential benchmark for a hospital project will produce a badly undersized result.
Step three converts water demand into expected sewage generation using the return-flow assumption, typically 80 percent of water supply, though this can be adjusted based on the specific water-use pattern of the project, for example a project with significant outdoor irrigation demand that does not return as sewage might warrant a lower return-flow percentage.
Step four applies a peak factor to account for the fact that wastewater generation is not flat across a 24-hour period. Peak factors commonly range from 1.25 to 2.0 depending on project type, with tighter, more concentrated usage patterns like office buildings or schools warranting higher peak factors than residential projects where usage is spread more evenly across the day. This peak flow figure matters most for sizing equalization tanks and hydraulic components, even though the biological treatment stage itself is usually still sized around average daily flow.
Step five adds a safety margin, typically 10 to 20 percent, for future growth, occupancy ramp-up, or measurement uncertainty, then rounds to a practical, commercially available nameplate capacity rather than an oddly specific figure that has no standard equipment match.
Worked example: residential society
Consider a residential society with 300 flats, averaging 4 persons per flat, giving a population equivalent of 1,200 people. Applying the standard CPHEEO urban benchmark of 135 LPCD gives a daily water demand of 1,200 multiplied by 135, or 162,000 litres per day. Applying the 80 percent return-flow assumption gives expected sewage generation of approximately 129,600 litres per day, or roughly 130 KLD.
Adding a 15 percent safety margin for future occupancy and measurement uncertainty brings this to approximately 149 KLD, which would typically round up to a 150 KLD nameplate plant as the practical procurement size, subject to final confirmation against actual metered water consumption once available.
Worked example: hotel
Hotel wastewater calculation differs from residential because occupancy and per-guest water consumption both run higher, and food and beverage operations add an additional load that residential projects don't have. For a 150-room hotel assuming double occupancy and a per-guest water consumption benchmark of around 180 to 200 LPCD, reflecting higher usage from guest bathrooms, laundry, and housekeeping compared to residential, the population equivalent works out to roughly 300 guests.
Using 190 LPCD as a representative figure, water demand comes to 300 multiplied by 190, or 57,000 litres per day, giving expected sewage generation of approximately 45,600 litres per day at the 80 percent return-flow assumption. Kitchen and laundry operations typically add further load not fully captured in the per-guest figure, so hotel projects commonly build in an additional 15 to 20 percent above the calculated guest-based figure to account for food and beverage and housekeeping operations, bringing the practical design figure to roughly 54 to 57 KLD, which would typically round to a 60 KLD class plant.
Worked example: hospital
Hospital STP sizing needs particular care because per-bed water consumption is significantly higher than residential norms, and the effluent itself often needs additional treatment consideration given biomedical wastewater concerns. A common benchmark for hospital water consumption ranges from 400 to 450 litres per bed per day, reflecting the intensity of water use in patient care, sterilization, laundry, and kitchen operations.
For a 150-bed hospital using 425 LPCD as a representative figure, water demand comes to 150 multiplied by 425, or 63,750 litres per day, giving expected sewage generation of roughly 51,000 litres per day at standard return-flow assumptions. Hospitals typically warrant a higher safety margin than residential projects, often 20 percent or more, given both the clinical importance of uninterrupted treatment capacity and the higher variability in actual bed occupancy compared to a stable residential population. This brings the practical design figure to approximately 61 KLD, commonly rounded to a 65 to 70 KLD class plant, though larger hospitals with significant diagnostic or surgical operations may need a dedicated capacity study rather than relying on per-bed averages alone.
Worked example: industrial and commercial units
Industrial and commercial projects are the hardest category to generalize, since water consumption depends heavily on the specific process rather than a stable per-person or per-unit benchmark. For office buildings, a per-employee benchmark of 45 LPCD is commonly used, reflecting basic sanitary and pantry use without the higher consumption patterns of residential or hospitality projects. For an office campus with 2,000 employees, this gives a water demand of 90,000 litres per day and expected sewage generation of roughly 72,000 litres per day, or 72 KLD, before peak factor and safety margin adjustments.
For manufacturing or processing facilities generating trade effluent, per-employee sanitary benchmarks are only part of the picture, since process wastewater volume depends entirely on the specific manufacturing operation and needs to be measured or estimated separately from domestic sewage generated by staff facilities. This is why our Sewage Treatment Plant projects for industrial clients typically start with actual site water-metering data rather than relying on generic per-employee assumptions alone, particularly where trade effluent volume significantly exceeds domestic sewage from staff facilities.
Sizing individual treatment components once total capacity is set
Once overall plant capacity is established, individual tank and equipment sizing follows from that headline figure combined with retention time requirements for each treatment stage. Equalization tank volume is commonly sized at 25 to 30 percent of daily flow, giving the system enough buffer to absorb hourly variation without shock-loading downstream biological treatment. Aeration tank volume depends on the specific biological technology chosen and its required hydraulic retention time, commonly in the range of 6 to 12 hours depending on the process, meaning a plant treating 150 KLD with an 8-hour retention time would need an aeration volume of roughly 50 cubic metres.
Clarifier or settling tank sizing depends on surface overflow rate rather than volume alone, since settling efficiency is governed by how much water passes through a given surface area per hour, which is why clarifier design typically references manufacturer-specific design tables rather than a single simple formula. This is one of the areas where a generic online calculator diverges most from an actual engineered design, since surface overflow rate calculations depend on sludge settling characteristics that vary by biological technology and influent composition.
Common mistakes in STP capacity calculation
Using water supply figures instead of actual metered consumption is one of the most frequent errors, particularly for projects still in the planning stage where design assumptions substitute for real data. Where metered consumption is already available, reconciling it against the CPHEEO-based estimate before finalizing capacity avoids locking in a figure based purely on theoretical assumptions.
Applying residential per-capita norms to non-residential projects produces systematically undersized results for hotels, hospitals, and commercial buildings, all of which have meaningfully different water-use patterns than a standard residential benchmark assumes.
Ignoring occupancy ramp-up in phased developments leads to plants commissioned at day-one occupancy that become undersized within a year or two as a project fills up. Sizing around a realistic multi-year occupancy projection, not just handover-day numbers, avoids a costly early retrofit.
Skipping the peak factor adjustment for hydraulic and equalization sizing while correctly applying it to overall daily capacity is a subtler mistake, since biological treatment capacity is usually sized around average flow while equalization and pumping need to handle peak flow, and conflating the two can leave equalization capacity too small even when the headline plant capacity figure looks correct.
For a full breakdown of how capacity translates into project cost across different KLD ranges, our STP Plant Cost & Price guide covers the capacity-wise cost picture once you have a target KLD figure in hand.
How to sanity-check a vendor's quoted capacity
Once a vendor proposes a specific KLD figure, it is worth working backward through their assumptions rather than accepting the number at face value. Ask what per-capita or per-unit consumption figure was used, and check it against the CPHEEO benchmark appropriate for your project type. A quoted capacity that seems unusually low relative to your own back-of-envelope calculation using standard benchmarks is worth questioning, since undersized proposals sometimes reflect an attempt to win on price rather than an accurate engineering assessment.
Equally, a quoted capacity that seems unusually high relative to your calculated figure is worth questioning too, since oversizing inflates both capital cost and, in some cases, ongoing operating cost if the plant runs inefficiently at well below its design load for extended periods. A well-engineered proposal should be able to show its population equivalent assumption, per-capita consumption figure, return-flow percentage, and safety margin separately, rather than presenting only a final KLD number without the underlying calculation. This transparency matters particularly for larger projects where the difference between a correctly sized plant and a poorly sized one, in either direction, represents a meaningful capital and operating cost difference over the plant's lifetime.
For industrial and ETP projects specifically, ask whether the quoted capacity is based on actual site water-metering data or on generic industry-average assumptions. A proposal built on generic assumptions for your specific manufacturing process carries meaningfully more risk than one grounded in real measured flow, and it is reasonable to request that a vendor either conduct site metering or clearly flag where their figures are estimates pending confirmation.
Frequently Asked Questions
What LPCD figure should I use if my project doesn't fit a standard category?
Start with the closest CPHEEO benchmark for a comparable project type, then adjust based on any specific water-use factors unique to your project, such as amenities, food service operations, or process water needs. Where reasonable metered data exists for a similar operating project, reconciling against real consumption figures is more reliable than relying purely on generic benchmarks.
How much safety margin should I add to my calculated capacity?
A 10 to 20 percent margin is common practice, with the higher end appropriate for projects with significant occupancy uncertainty, phased development, or critical continuity requirements like hospitals. Projects with well-established, stable occupancy patterns can generally work with a margin closer to 10 percent.
Should I round my calculated capacity up or down to a standard plant size?
Round up. STP equipment and civil design are generally standardized around common nameplate capacities, and rounding down to save on upfront cost risks undersizing the plant relative to your actual calculated demand, particularly once peak factors and safety margins are properly applied.
Does peak factor apply to the whole plant or just certain components?
Peak factor primarily affects hydraulic components like equalization tanks, pumps, and piping, which need to handle short-term flow spikes without overflow or backup. Biological treatment capacity is typically sized around average daily flow rather than peak flow, since equalization is specifically designed to smooth out these peaks before they reach the biological stage.
How is industrial ETP capacity different from STP capacity calculation?
Industrial effluent volume depends on the specific manufacturing process rather than a stable per-person benchmark, so ETP capacity calculation typically relies on actual site water-metering and process flow data rather than population-based formulas. Domestic sewage from staff facilities at an industrial site is usually calculated separately using standard per-employee benchmarks and either treated alongside or separately from the trade effluent stream depending on plant design.
What questions should I ask a vendor to verify their quoted STP capacity?
Ask for the population equivalent, per-capita consumption figure, return-flow percentage, and safety margin used to reach their final KLD number, rather than accepting a single figure without the underlying assumptions. A proposal that cannot show this working is harder to evaluate against your own calculation or against competing quotes.
Is it better to slightly oversize or undersize an STP if I'm unsure of future occupancy?
Slight oversizing is generally the safer direction, since an undersized plant risks compliance failures and a costly retrofit once real occupancy is reached, while a modestly oversized plant mainly costs more upfront capital without the operational and regulatory risk that comes with undersizing. That said, significant oversizing beyond a reasonable safety margin wastes capital without a corresponding benefit, so the goal is a realistic occupancy projection with a sensible margin, not maximum capacity regardless of cost.
Need help calculating the right capacity for your project? Trity Environ Solutions sizes STP and ETP systems around actual site data and occupancy projections rather than generic online calculators, across residential, hospitality, healthcare, and industrial projects. Get in touch for a technical consultation.