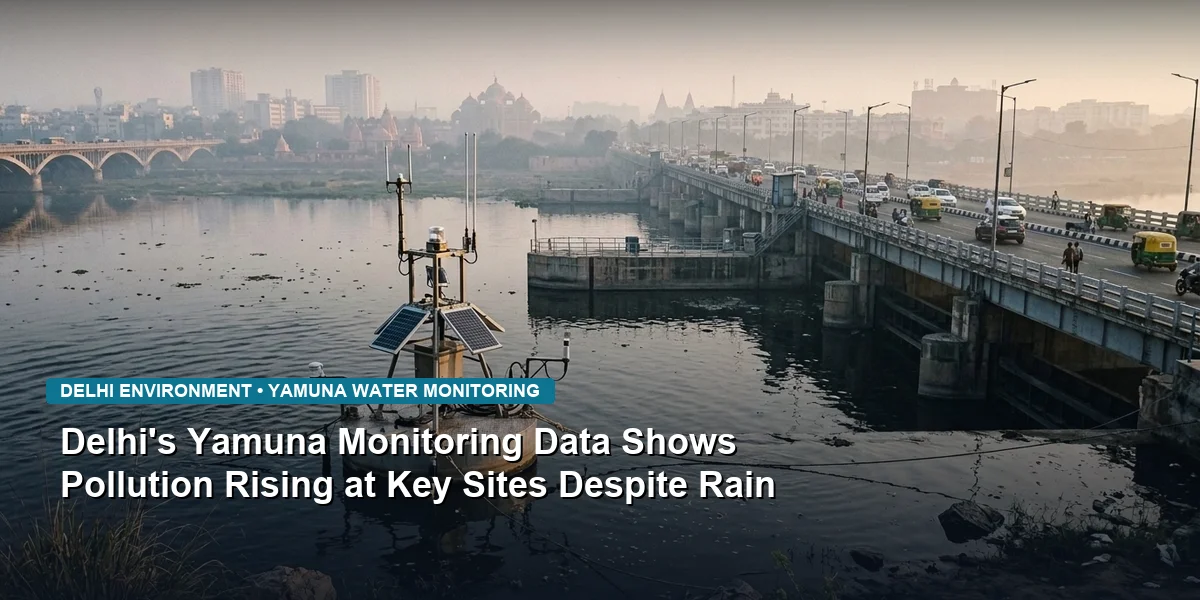
Water quality data uploaded by the Delhi Pollution Control Committee (DPCC) shows pollution levels at several points along the Yamuna's Delhi stretch worsened in September 2026 compared to August, a trend that stands out because it came during a period when monsoon rainfall would typically be expected to dilute and flush pollutant concentrations downstream.
Where the River Is Getting Worse
The DPCC's monitoring network tracks seven locations along the river, from where it enters Delhi at Palla Village to where it exits at Jaitpur. Faecal coliform readings, measured in MPN per 100 ml, rose sharply at three of these sites between August and September:
- Wazirabad: climbed from 1,100 to 1,300 MPN/100 ml
- Nizamuddin Bridge: climbed from 13,000 to 15,000 MPN/100 ml
- Yamuna at Asgarpur (Kidwali, bordering Haryana): climbed from 36,000 to 38,000 MPN/100 ml
Where Conditions Held Steady or Improved
Not every monitoring point moved in the same direction, which is itself informative about where the pollution load is actually entering the river:
- ISBT Bridge and ITO Bridge stayed essentially flat, at 35,000 and 17,000 MPN/100 ml respectively
- Palla improved, dropping from 1,400 to 1,100 MPN/100 ml
- Okhla Barrage also improved, from 23,000 to 21,000 MPN/100 ml
The pattern suggests the deterioration is concentrated in the stretch between Wazirabad and the Haryana border rather than being a uniform, river-wide decline, which points toward localized discharge sources rather than a basin-wide monsoon effect.
BOD Levels Well Above the Safe Limit
Biochemical Oxygen Demand (BOD) is one of the clearest indicators of organic pollution and sewage contamination in a water body, since it measures how much oxygen microorganisms consume while breaking down organic waste. Lower BOD means cleaner water; higher BOD means heavier organic and sewage loading.
- The prescribed water quality criterion caps BOD at 3 mg/l
- Several Yamuna monitoring sites recorded BOD readings ranging from 2 to 30 mg/l, meaning the worst-affected points were ten times over the permissible limit
- ISBT Bridge recorded the highest reading in the dataset, at 30 mg/l, up from 28 mg/l in August
Why This Matters During the Monsoon Window
Monsoon flows typically increase the river's overall volume and flushing rate, which should dilute pollutant concentrations even if the absolute amount of pollution entering the river stays constant. Readings that rise anyway, as several did here, point to either:
- A genuine increase in the volume of untreated or partially treated sewage and wastewater reaching the river during this period, or
- Monsoon runoff itself carrying additional organic and faecal contamination from drains, informal settlements and surface areas directly into the river
The DPCC's September data release also included wastewater figures from Delhi's major drains, which separately showed high BOD and Total Suspended Solids (TSS) levels, reinforcing that untreated or inadequately treated sewage discharge remains a significant, ongoing contributor to the river's pollution load rather than an isolated event.
The Bigger Picture for Delhi's Sewage Infrastructure
These numbers add to a now-familiar pattern documented across multiple DPCC and CPCB monitoring cycles: Delhi's installed sewage treatment capacity has not kept pace with the volume of wastewater the city actually generates, and gaps in sewer network coverage mean a share of that wastewater bypasses treatment altogether and reaches the river through open drains.
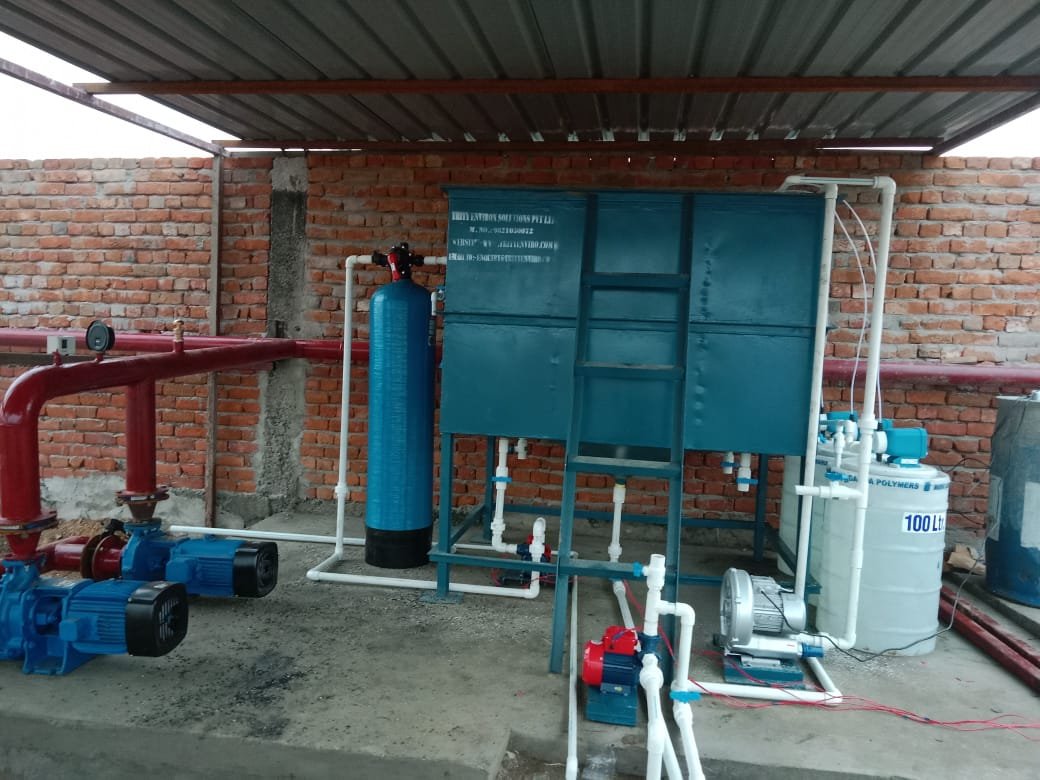
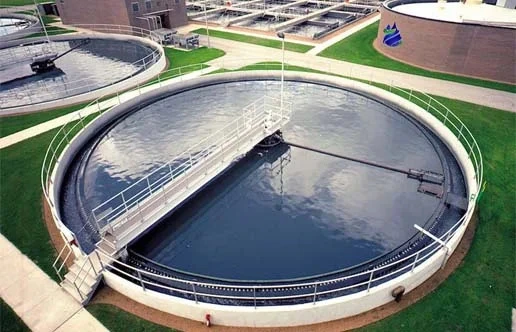
For the stretch of river running through the capital, closing that gap depends on expanding both treatment capacity and the sewer network that feeds it, alongside stricter monitoring of the drains that discharge directly into the Yamuna. Properly maintained sewage treatment plants, consistent effluent quality monitoring at drain outfalls, and reducing reliance on informal or partially treated discharge routes remain the most direct levers available for bringing BOD and faecal coliform levels back within prescribed limits at these pressure points.