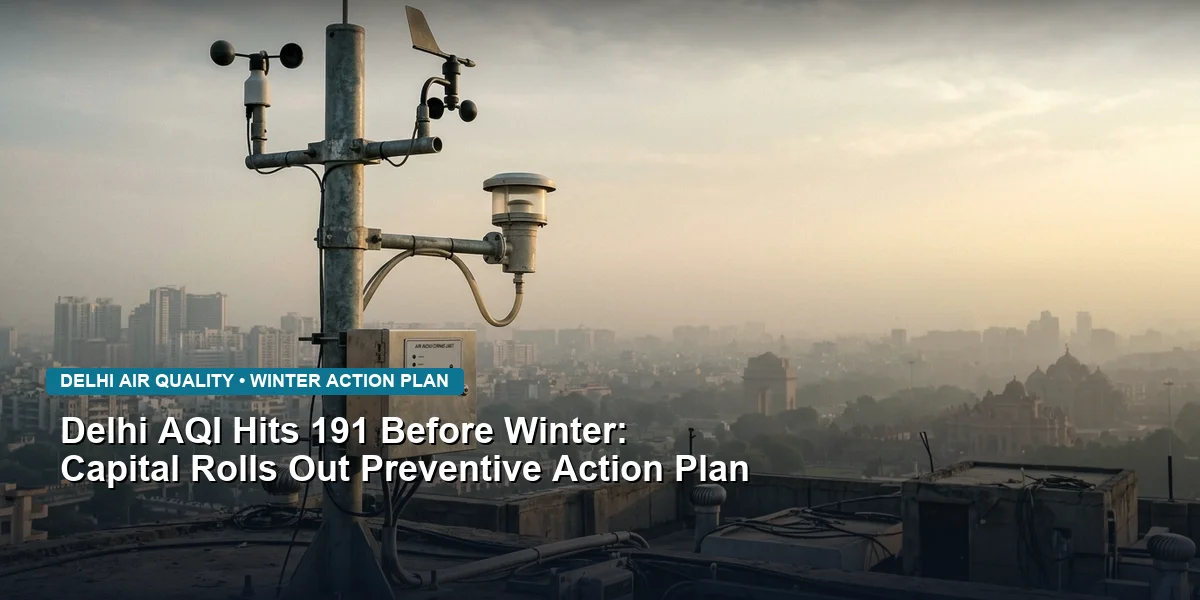
Delhi did not appear among the world's 20 most polluted cities on Monday afternoon, October 19. That is a snapshot, not a verdict. Hours earlier, the capital's air had worsened overnight and peaked at a US AQI of 191.
The swing shows how thin the margin is as the winter pollution season approaches, and why the city's new preventive plan matters.
What the Numbers Showed on October 19
The ranking cited by The Tribune was taken at about 3:30 pm on Monday and is based on AQI.in data. Delhi was not on it.
Delhi's day
- Air quality worsened overnight and peaked at a US AQI of 191 at 7:31 am on October 19
- It then fell into the 130s during the afternoon
The top of the global list
- Palangkaraya, Indonesia: 242
- Palembang, Indonesia: 207
- Bulandshahr, India: 198
- Agartala, India: 181
- Pali, Muzaffarnagar and Burhanpur: 174 each
- Rohtak: 172
Kota, Mumbai, Hapur, Hisar, Bikaner and Bareilly also featured, without figures in the report. The Tribune said 13 Indian cities were in the top 20, though it named only 12 of them.
The article's own warning is worth repeating: Delhi may disappear from a global ranking within hours as conditions change, but its pollution problem does not disappear with it.
Why a Good Afternoon Does Not Mean Clean Air
Delhi's air responds quickly to weather. A recent analysis from the Centre for Science and Environment (CSE), reported on September 30, looked at the 2026 summer and monsoon and found how fragile the improvement is.
What CSE found
- Delhi had only one "Good" air day in the 92 days of the monsoon (June 1 to August 31), on July 9, despite 576.9 mm of rainfall
- Average PM2.5 fell from 60.2 micrograms per cubic metre in summer to 40.2 in the monsoon, a decline of about 33%
- The heaviest daily rainfall, 101.05 mm on August 8, still produced only a "Satisfactory" AQI
- Around six isolated rain events, PM2.5 averaged 40.6 before rain, 32.7 during rain, 36.2 a day after and 45.1 at 48 hours, which is 11.1% above the pre-rain level
What CSE says explains it
CSE attributes the persistence to high baseline emissions from vehicles, industry, waste burning and power generation, which rebuild pollution quickly once the rain stops. Gaseous pollutants such as ozone, nitrogen dioxide and carbon monoxide became the main AQI driver as particulates were washed out.
CSE notes the study shows statistical associations only. It does not separate rainfall from other weather factors or changes in emissions.
Two AQI Scales, Two Different Readings
The 191 figure in the report is a US AQI, the scale used by AQI.in and many global trackers. India's official National Air Quality Index, used by the Central Pollution Control Board, has different breakpoints, so the same pollution level can carry a different number and label on each scale.
- On the US scale, 151 to 200 is classed as "unhealthy" for everyone, and 191 sits near the top of that band
- India's National AQI uses categories of Good, Satisfactory, Moderate, Poor, Very Poor and Severe, with its own numerical ranges
The practical lesson is to compare like with like. A US AQI reading in a global ranking should not be set directly against a CPCB bulletin figure for the same city, and the Tribune report does not say which Indian-scale figure applied on October 19.
Why Early Winter Is a Pressure Point
Mid to late October is when conditions begin to turn. Winds weaken, mornings cool and pollutants stay closer to the ground, so emissions that were dispersed during the monsoon start to accumulate. The overnight rise to 191 and the afternoon drop into the 130s fit that pattern of strong morning peaks. This is general background on seasonal behaviour, not a finding from the report, but it explains why the city is putting measures in place now instead of waiting for GRAP stages to trigger.
Earlier Signs This Month
Other readings in early October point the same way. A UNI India report on October 9 gave Delhi's AQI at 176 and Gurugram's at 201, up from 180 the previous day, moving it from the moderate to the poor category.
The Winter Action Plan 2026-27
The Delhi government's response, as described in the report, is to act before pollution peaks rather than wait for it.
Measures listed
- Higher parking charges
- Restrictions on non-BS-VI vehicles registered outside Delhi
- Staggered office timings and reduced government office staff
- Construction restrictions
- 30 electric mechanical road sweepers approved for 609 km of smaller roads
- A five-year collaboration with IIT-Delhi to identify PM2.5 and PM10 sources in real time
- A monitoring network that has expanded to 60 air-quality stations
Dates already set
Down To Earth reported on October 5 that two measures have dates:
- The "No PUCC, No Fuel" rule was intensified from October 1 at 500 fuel stations using automatic number plate recognition
- Entry restrictions for non-BS-VI vehicles registered outside Delhi apply from November 1
The same report lists construction bans, work-from-home provisions, higher parking charges and a revised Graded Response Action Plan by the Commission for Air Quality Management (CAQM) as part of the changes, but it does not give start dates, penalty amounts or the GRAP stage for bus restrictions, so none are stated here.
Why Source Identification Matters
The IIT-Delhi collaboration is aimed at a long-standing gap. Without real-time source data, actions tend to be broad and delayed. If monitoring can show whether a spike comes from vehicles, dust, industry or burning, enforcement can be targeted.
Industry's part
Industrial units in the National Capital Region are expected to control stack emissions and report them. Reliable, calibrated monitoring helps operators spot deviations before an inspection does. Stack gas analysers for SOx and NOx, such as those on the SOx NOx gas analyser page, give plant teams the same real-time view that regulators use.
What Residents and Organisations Can Do Now
For households and offices
- Check vehicle pollution certificates and fuel only where the rules require it
- Plan for staggered timings and remote work where employers offer them
- Keep construction and renovation dust covered and damped
For facility managers and industry
- Service diesel generators and confirm compliance before restrictions tighten
- Maintain dust controls at construction sites and material yards
- Keep emission monitoring equipment calibrated and records ready
What to Watch Next
- Daily AQI trend through late October, especially after any further rain
- Whether the November 1 vehicle restrictions are enforced consistently at entry points
- How CAQM's revised GRAP stages are triggered as readings rise
- Whether real-time source data from the IIT-Delhi project begins to inform enforcement